Clustering into same size clusters
Jun 9 2018 stats RUpdate Nov 23 2018: New iterative approach using hierarchical clustering and better graphs.
I would like to cluster points into groups of similar size. For example I would like to group 1000 points into clusters of around 20 points each. The two aspects that are important here are:
- The cluster size distribution (or the deviation from the desired cluster size).
- The quality of the clusters (i.e. how similar are points within a cluster).
In addition to the typical hierarchical clustering approach, I will test the following iterative approaches:
- Iterative dichotomy: large clusters are split in two until around the desired size (using hierarchical clustering).
- Iterative nearest neighbor: a point and its closest neighboring points are assigned to a cluster and removed before processing another point.
- Same-size k-Means Variation that some quick googling returned.
- Iterative “bottom-leaves” hierarchical clustering: keeping the first cluster of the desired size at the “bottom” of the dendrogram.
Methods
In the following \(s\) is the target cluster size.
Iterative dichotomy
Starting with one cluster containing all the points, a cluster is split in two if larger that \(1.5*s\). When all clusters are smaller than \(1.5*s\), the process stops.
The points are split in two using hierarchical clustering. I will try different linkage criteria. My guess is that the Ward criterion will be good at this because it tends to produce balanced dendrograms.
Iterative nearest neighbor
While there are more than \(s\) unassigned points:
- A point is selected. Randomly or following a rule (see below).
- The \(s-1\) closest points are found and assigned to a new cluster.
- These points are removed.
If the total number of points is not a multiple of \(s\), the remaining points could be either assigned to their own clusters or to an existing cluster. Actually, we completely control the cluster sizes here so we could fix the size of some clusters to \(s+1\) beforehand to avoid leftovers and ensure balanced sizes.
In the first step, a point is selected. I’ll start by choosing a point randomly (out of the unassigned points). Eventually I could try picking the points with close neighbors, or the opposite, far from other points. I’ll use the mean distance between a point and the others to define the order at which points are processed.
Same-size k-Means Variation
As explained in a few pages online (e.g. here), one approach consists of using K-means to derive centers and then assigning the same amount of points to each center/cluster.
In the proposed approach the points are ordered by their distance to the closest center minus the distance to the farthest cluster. Each point is assigned to the best cluster in this order. If the best cluster is full, the second best is chosen, etc.
I’ll also try to order the points by the distance to the closest center, by the distance to the farthest cluster, or using a random order.
Iterative “bottom-leaves” hierarchical clustering
While there are more than \(s\) unassigned points:
- A hierarchical clustering is built.
- The tree is cut at increasing level until one cluster is \(\gt s\).
- Assign these points to a cluster and repeat.
Instead of working at the level of the point, the idea is to find the best cluster at each step. The hierarchical clustering integrates information across all the (available) points which might be more robust than ad-hoc rules (e.g. nearest neighbors approach).
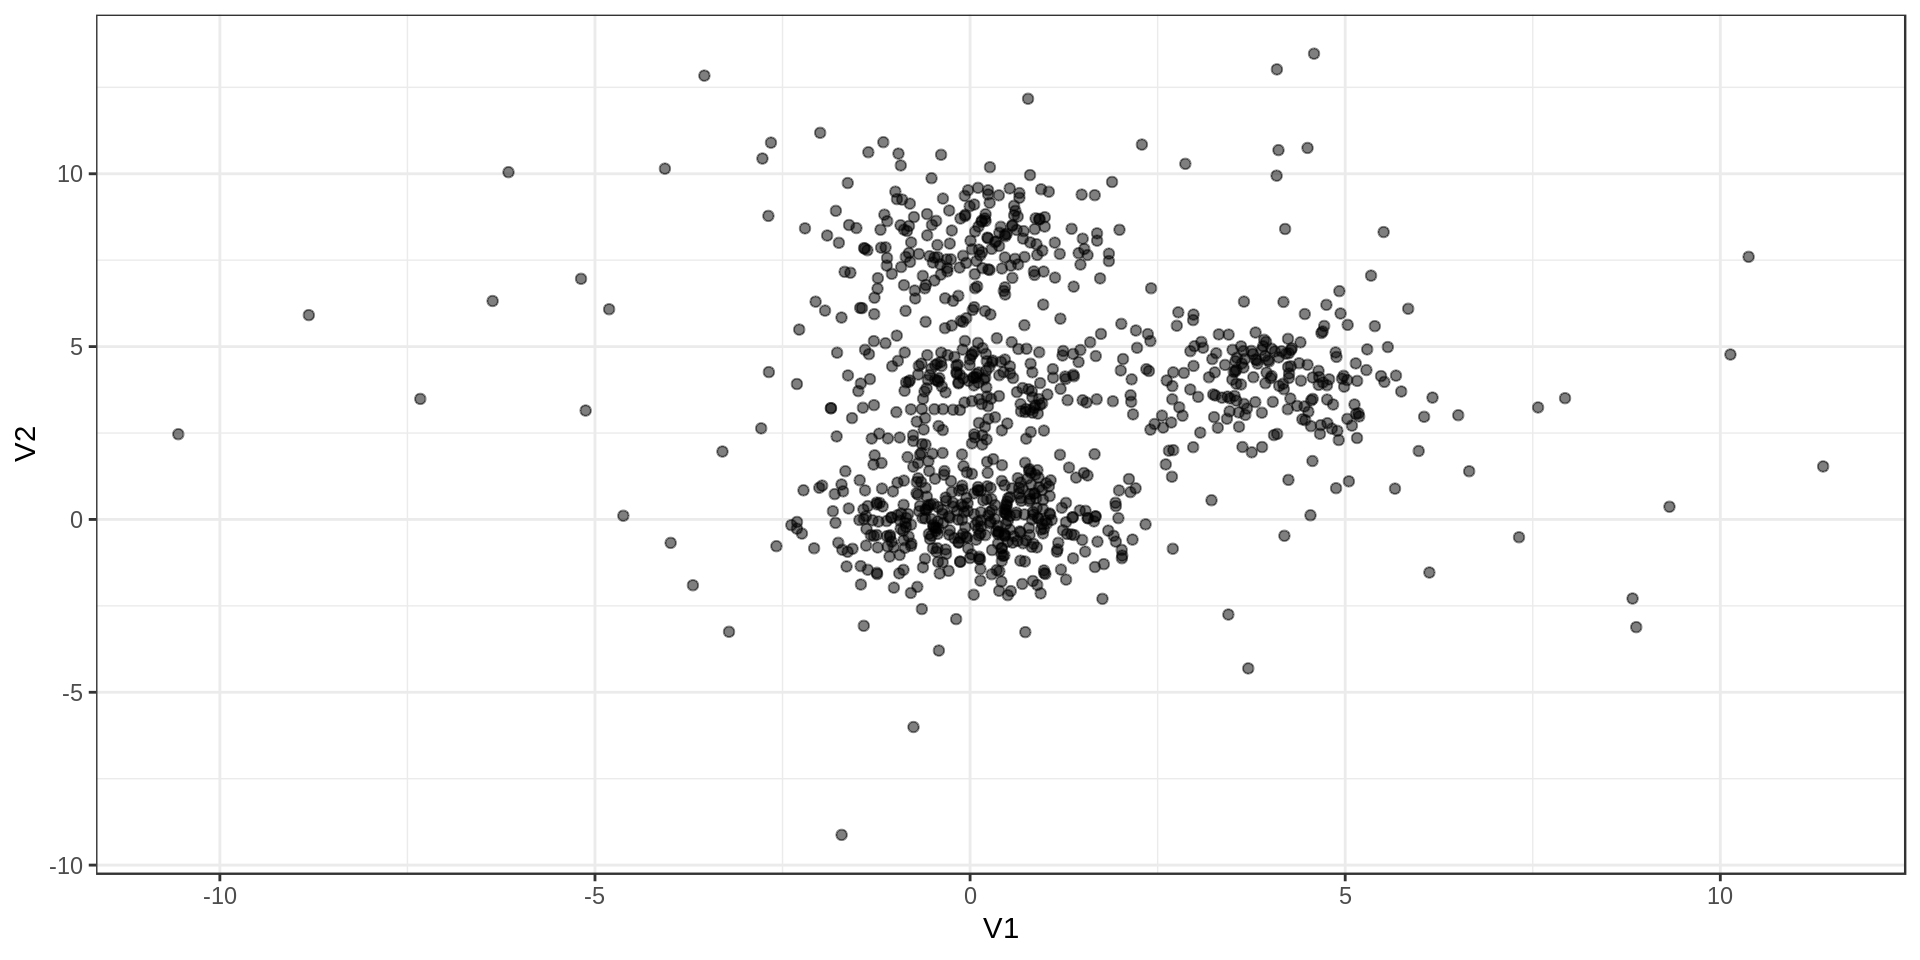
Test data
I’ll test the different approaches on dummy data with Gaussian distributions and some outliers. The 1000 points are grouped in 4 groups with one larger than the others. I added 100 outliers.
Results
Let’s aim for clusters of around \(s=21\) points. Why 21, and not 20? Because that way there will be “left-over” points (more realistic).
Cluster size
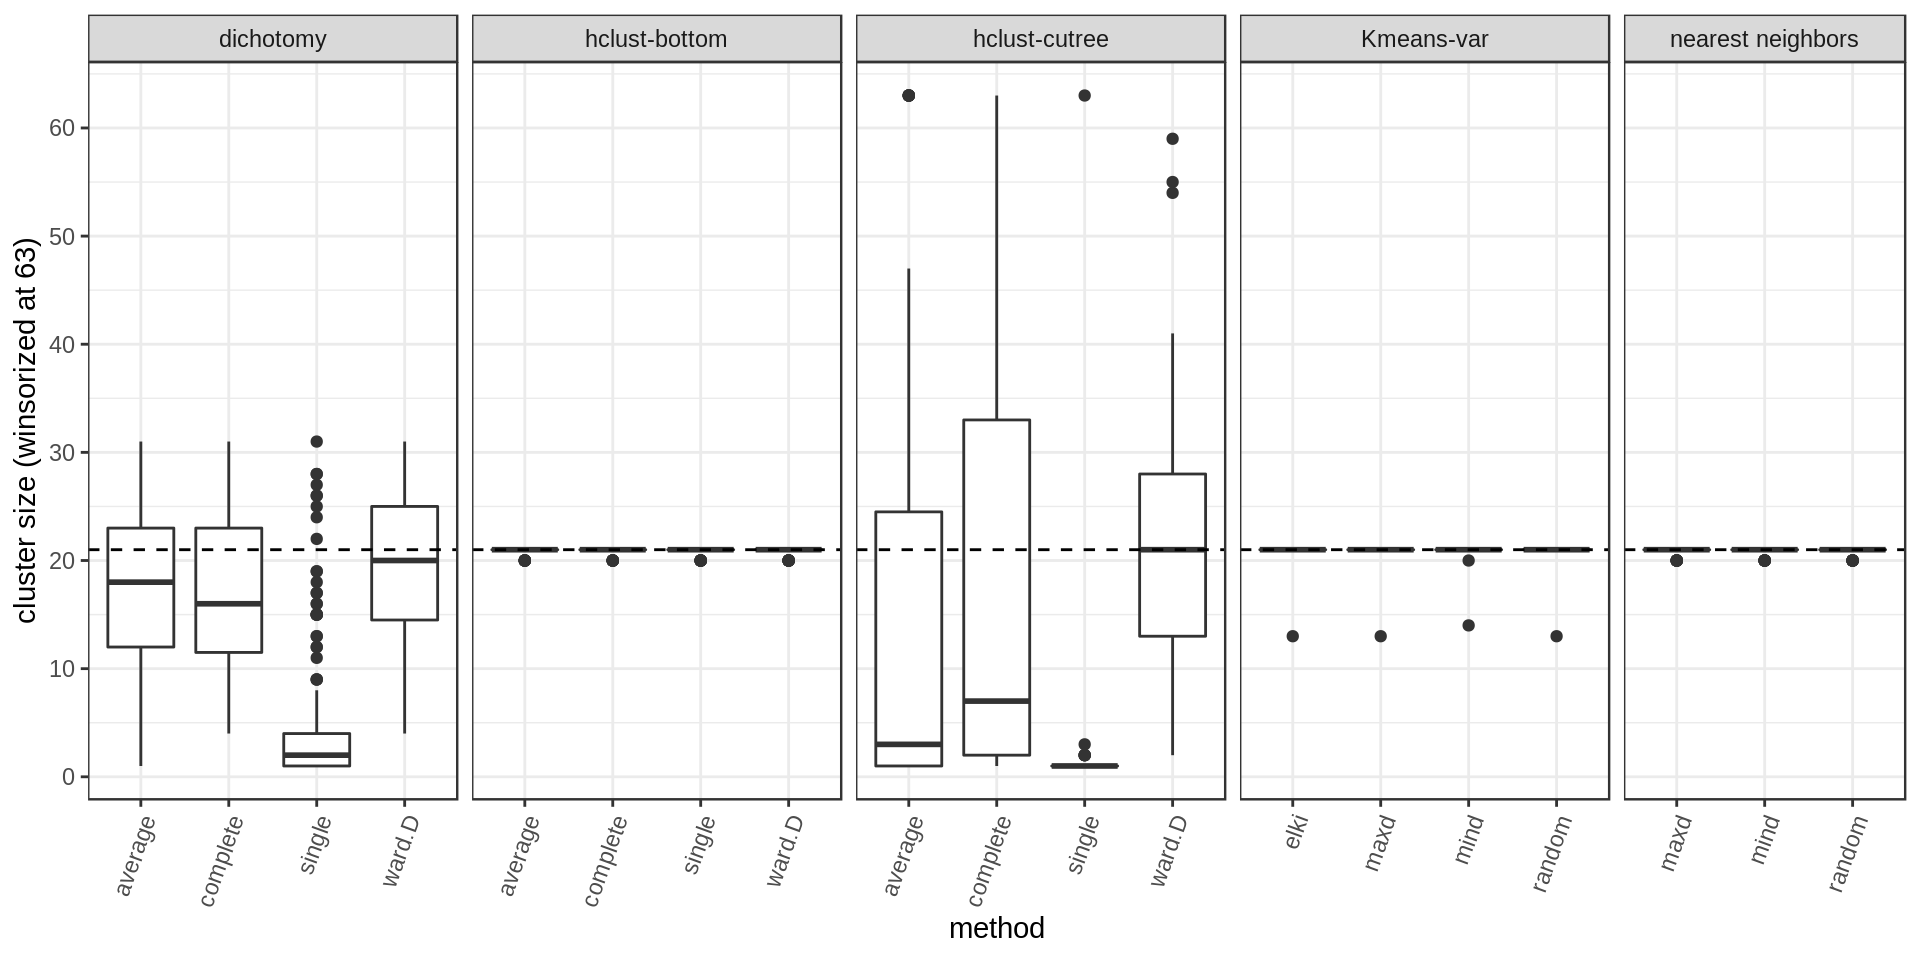
- The dichotomy and hclust sometimes produce an average cluster size close to the desired size but still many cluster are much smaller/bigger.
- As expected, we get the correct size when using the methods that specifically control for cluster size.
Within-cluster distance
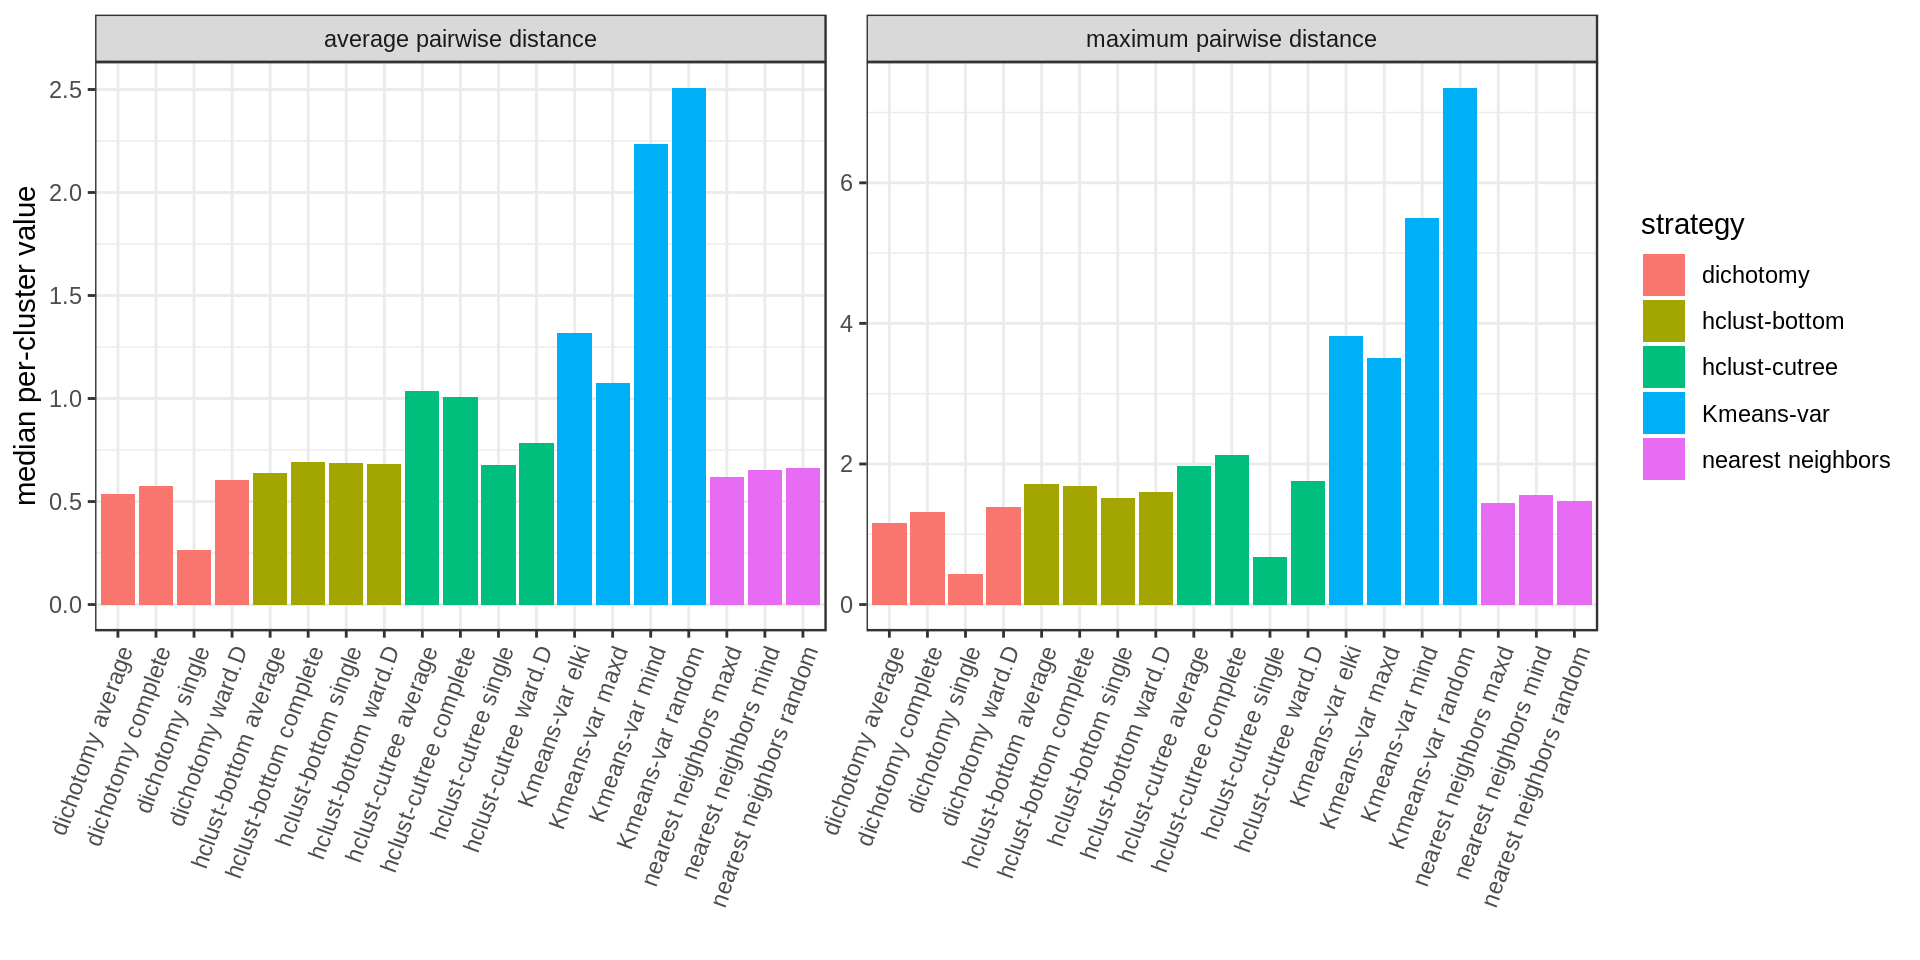
We compute the average pairwise distance per cluster and the maximum pairwise distance per cluster.
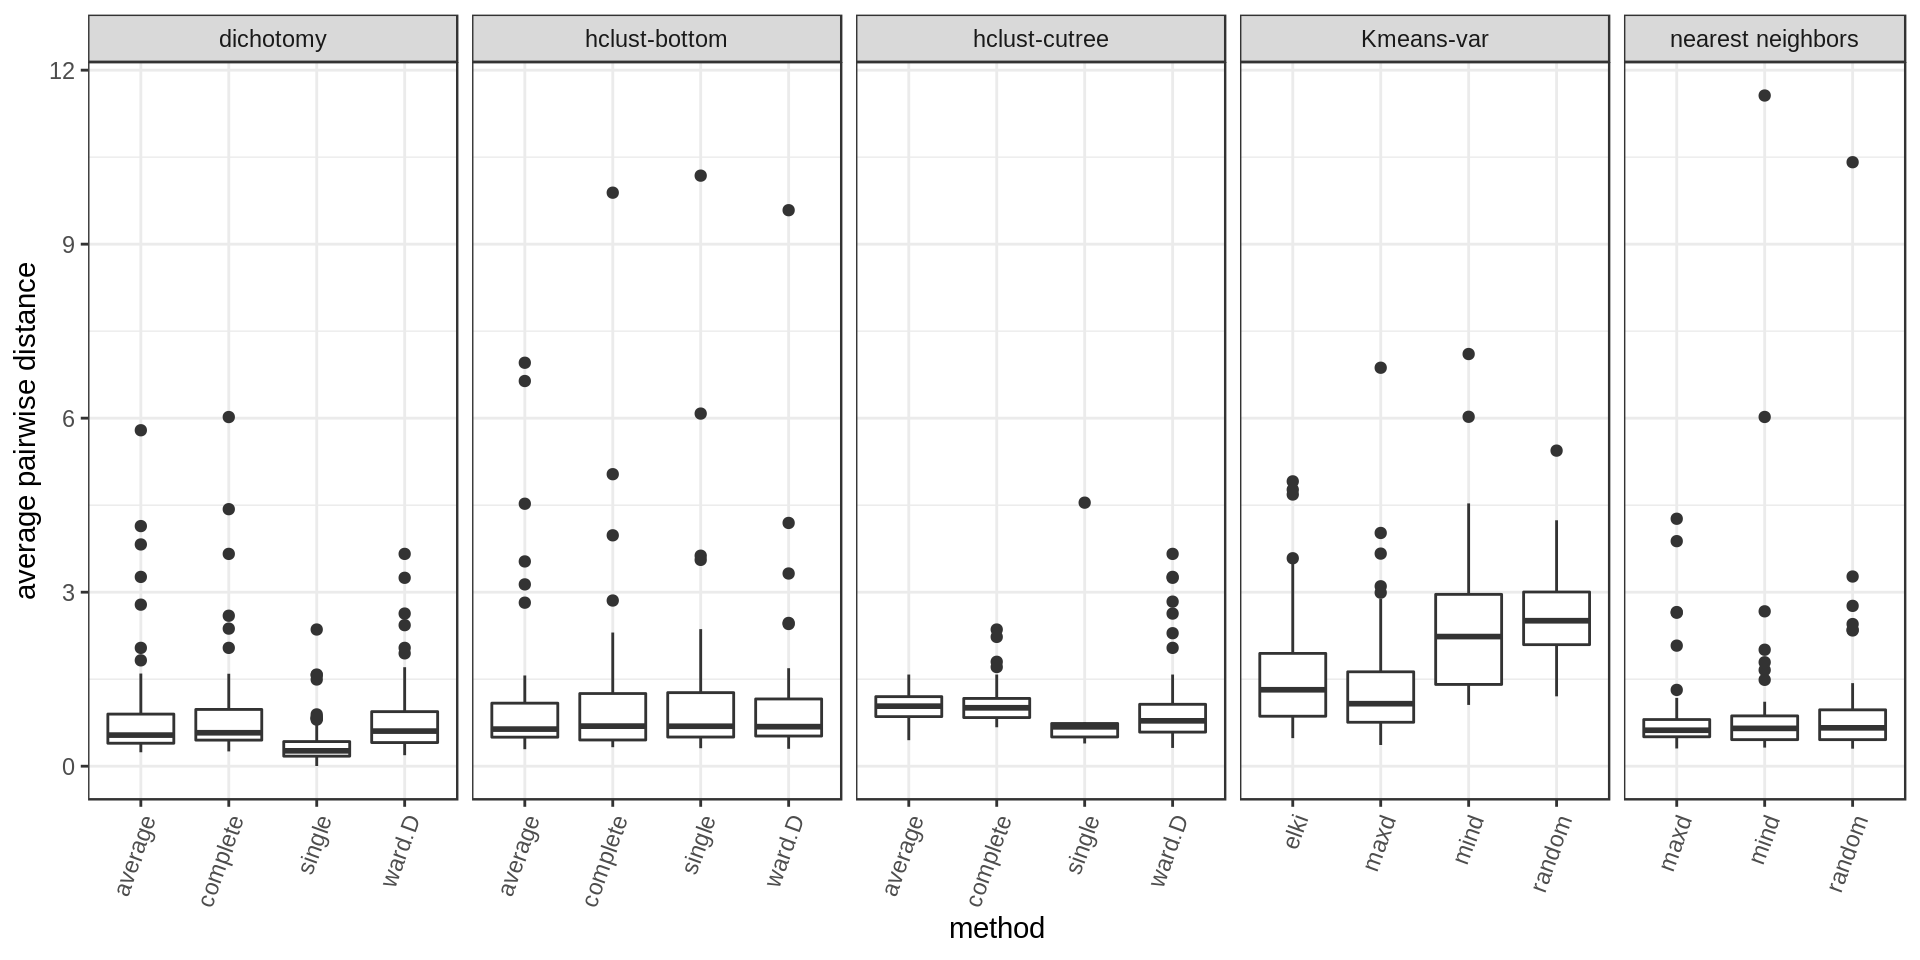
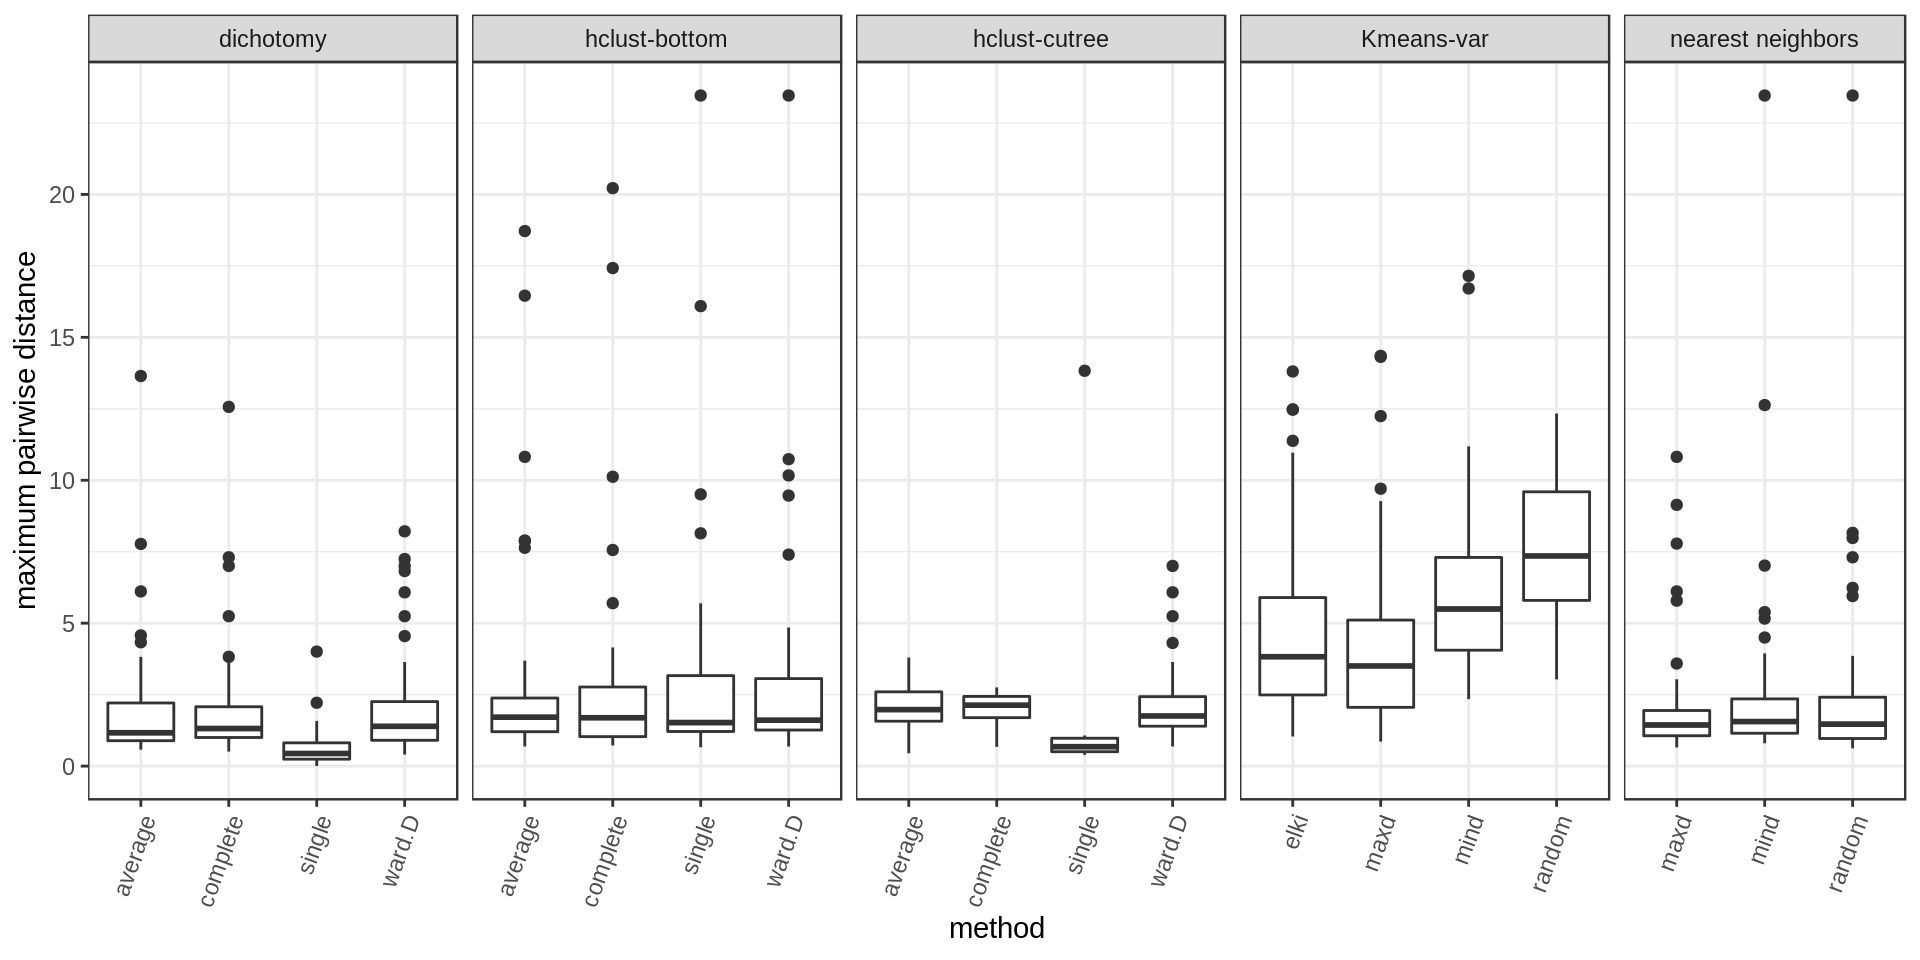
Several approaches perform well. Among the methods with cluster size control, hclust-bottom and nearest neighbors looks quite good considering that they have the additional constraint of the fixed cluster size. However we notice a few outlier points with high values. These are usually the last cluster of the iterative process, kind of a left-over cluster with many distant outlier points. That’s why the nearest neighbors approach with the maxD rule, which starts with outlier points on purpose, is performing better (narrower distribution and much weaker outliers).
A summary bar chart with the median values only:
Silhouette score
Another way of estimating cluster quality is the silhouette score. The higher the silhouette score for a point the better (the more it belongs to its cluster rather than another). We could look at the mean silhouette score per cluster or overall.
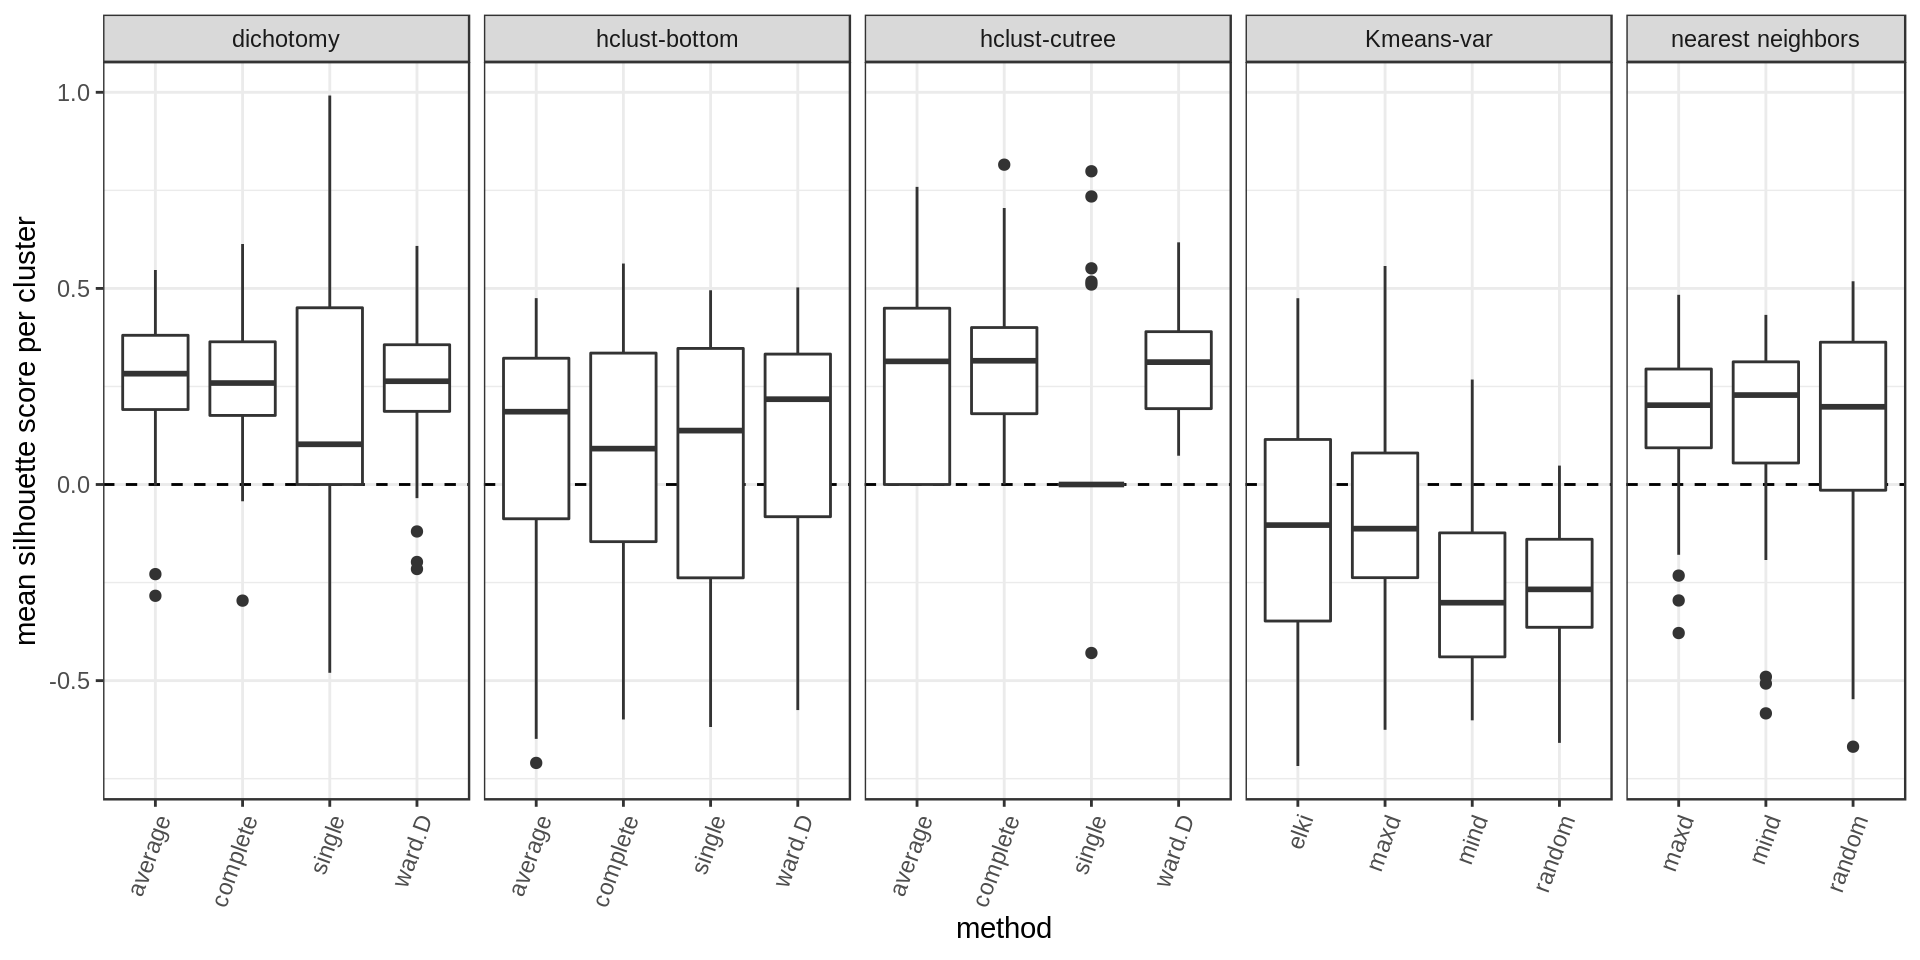
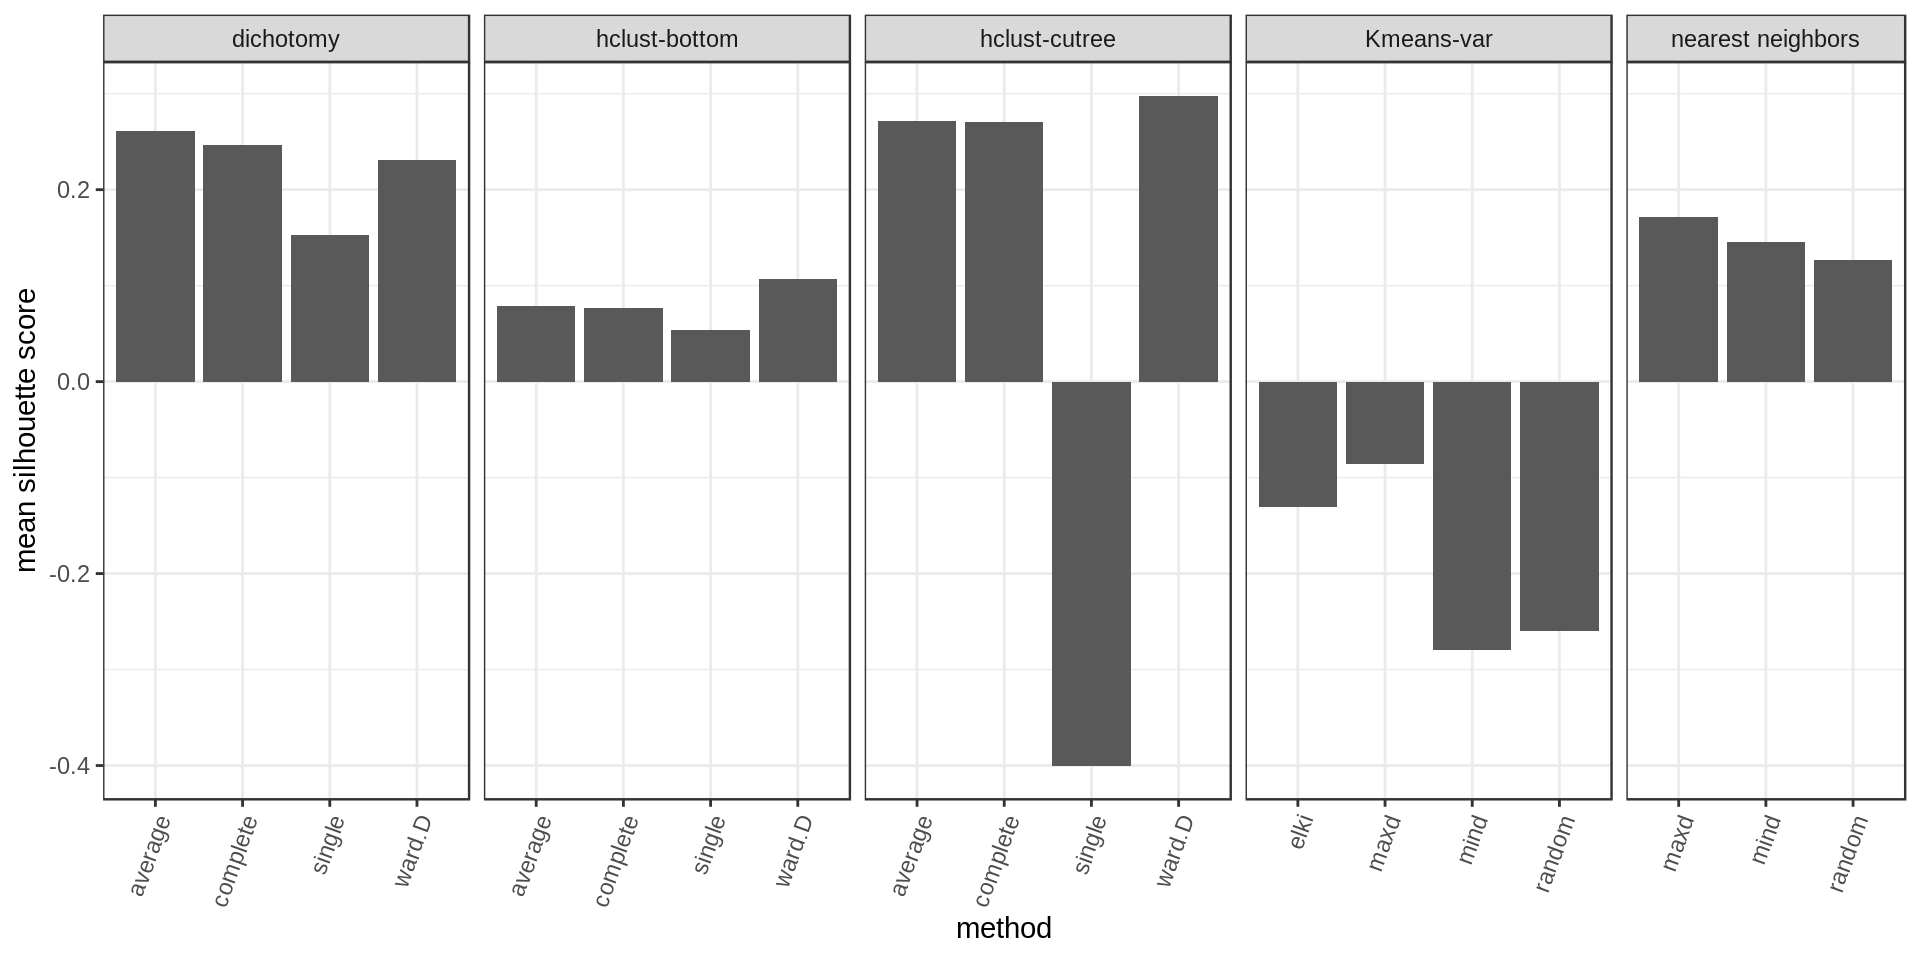
Again higher and narrower score distribution for the nearest neighbors with maxD rule.
Conclusions
The iterative dichotomy approach is not as bad as I thought, especially using Ward linkage criterion, but it doesn’t really controls for the final cluster size. We end up with most clusters around the desired size but the size of some clusters still vary by a factor of 2 or more.
The nearest neighbor approach (maxD variant), is the best approach in my opinion. The cluster size is completely controlled and the mean/maximum pairwise distance for points in the same cluster is similar (or better) to other approaches.
The K-means approach didn’t perform as well but we can keep it in mind if the number of points is very large, as it is much more memory efficient (no need for a pairwise distance matrix).
Although the “bottom-leaves” hierarchical clustering doesn’t look as good as the nearest neighbors, it might be more robust sometimes. In a real data analysis for example, I had noticed that it created better cluster (in my opinion). So, as usual, it would be a good idea to try several methods when analyzing a new dataset and see which behaves the best.
Extra: optimization
The nearest neighbor approach uses a while loop, which is not efficient in R.
Maybe implementing the loop with Rcpp could speed up the computation (in practice I would like to run this on up to 10K points).
After implementing the loop using Rcpp, I ran it on datasets of different size and got these computation times.
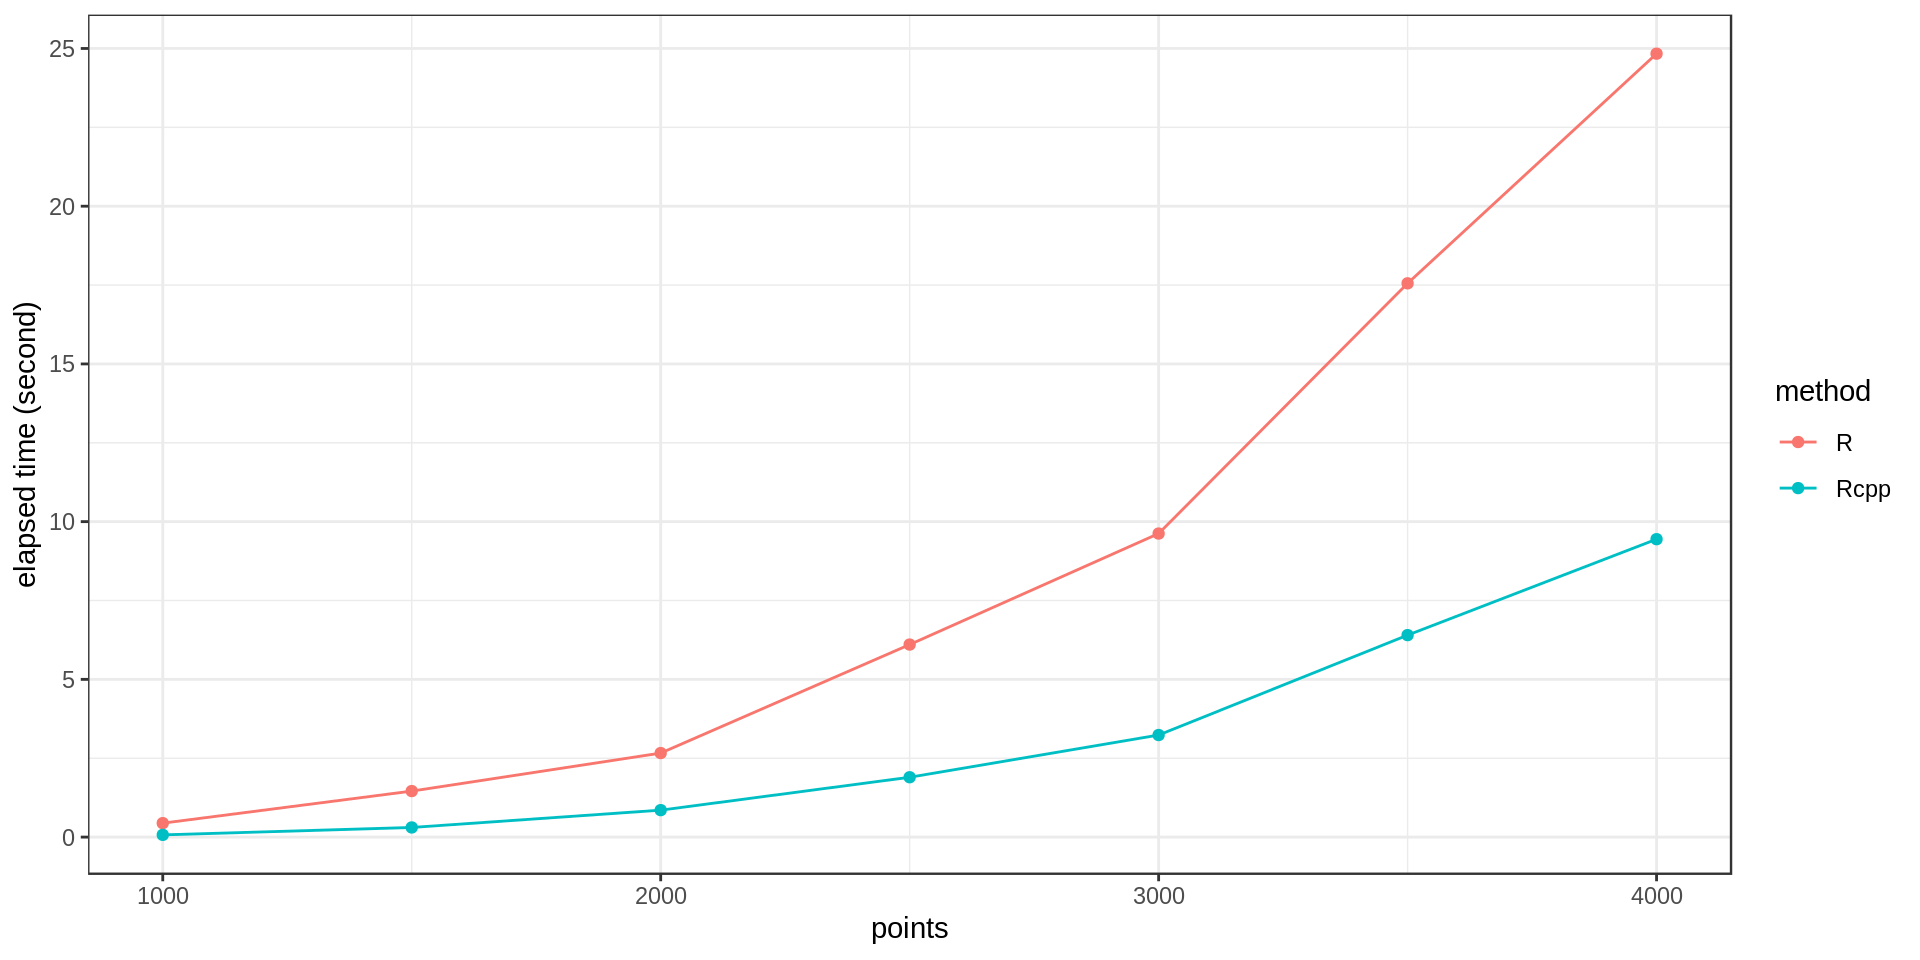
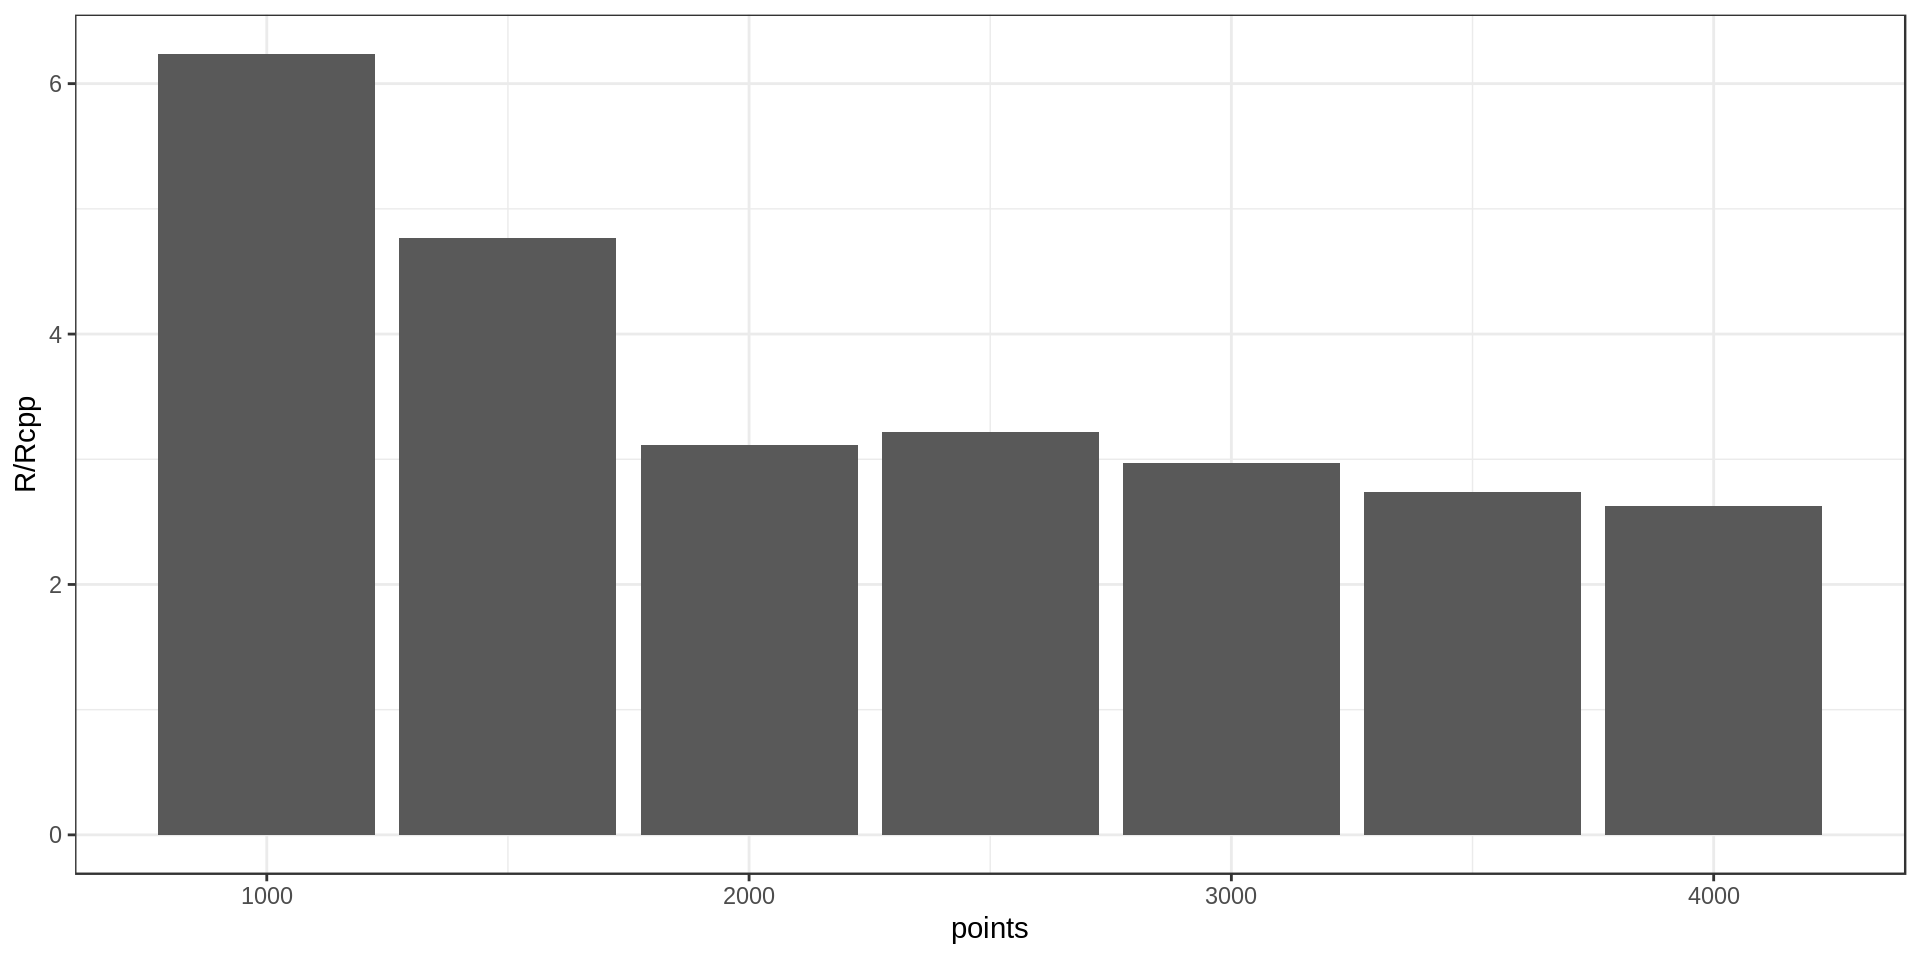
It’s around three times faster with Rcpp. Not bad!
Quick sanity check: are the results actually the same ?
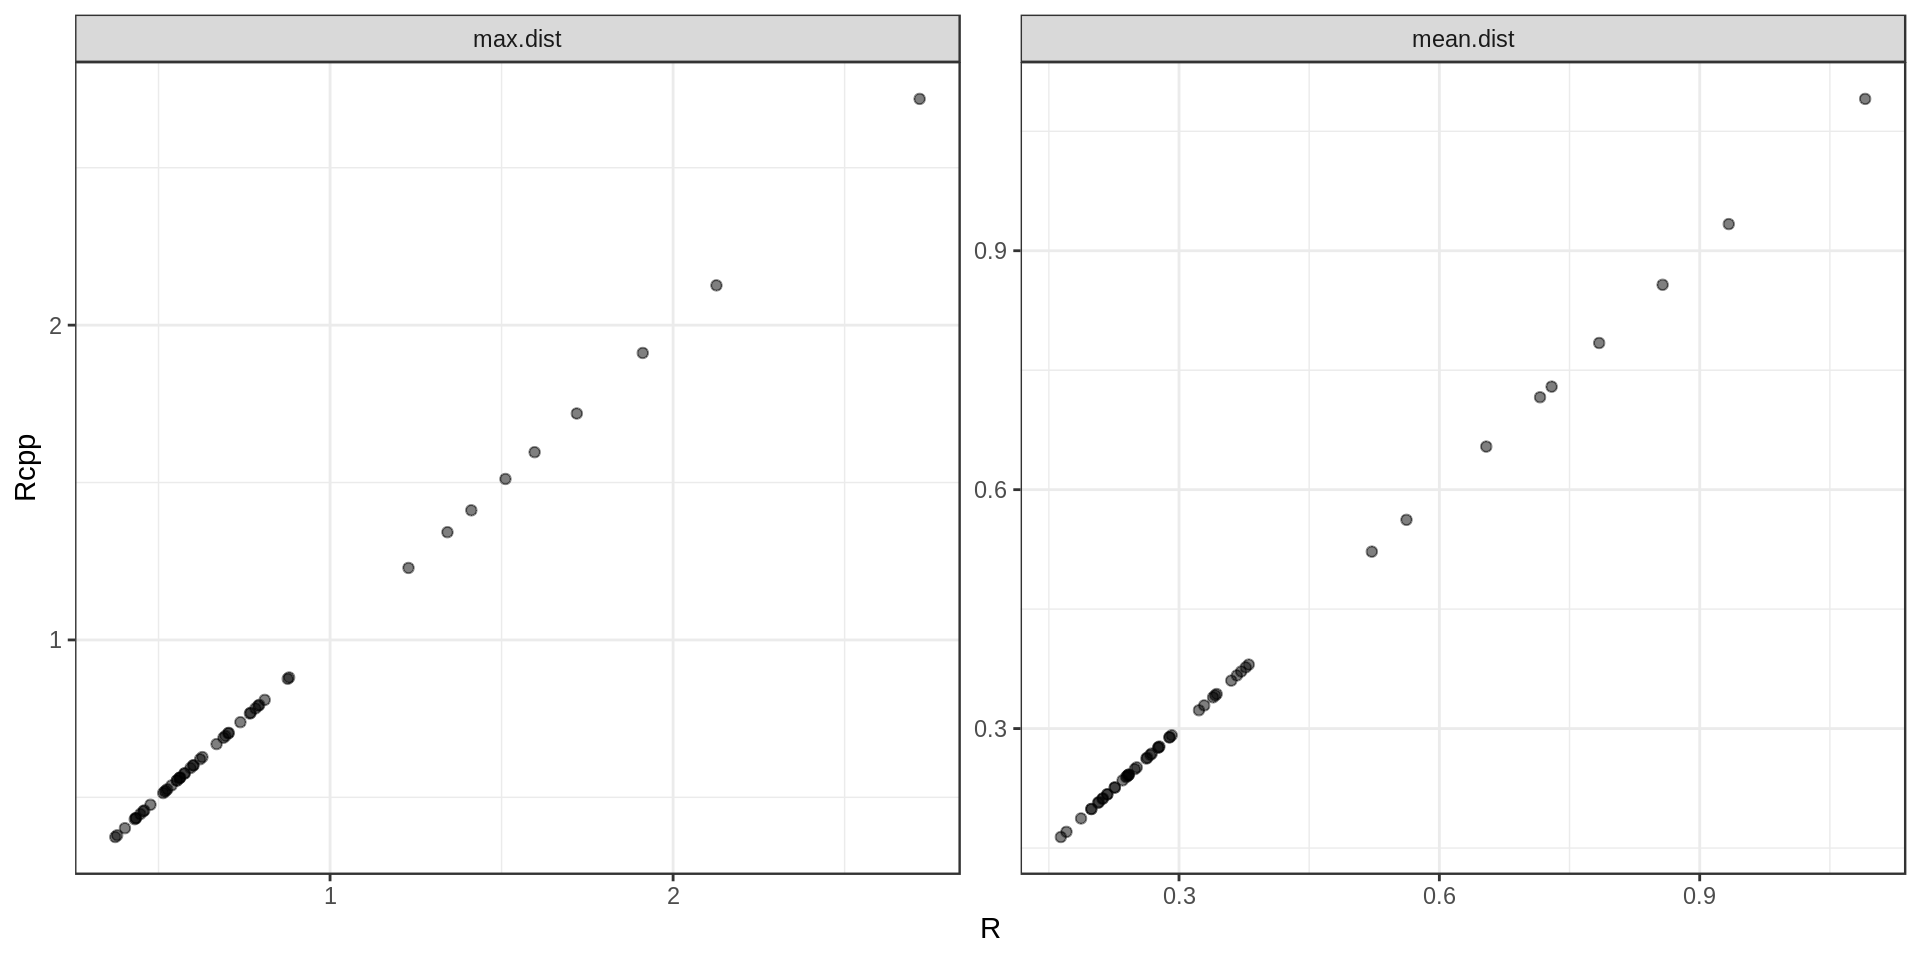
Yes. Ouf…
Code
The source code of this page can be found here.